m2aia package
m2aia.ImageIO module
- class m2aia.ImageIO.ImzMLReader(imzML_path, baseline_correction: Literal['TopHat', 'Median', 'None'] = 'None', baseline_correction_half_window_size: int = 50, normalization: Literal['TIC', 'Sum', 'Mean', 'Max', 'RMS', 'Internal', 'External', 'None'] = 'None', smoothing: Literal['SavitzkyGolay', 'Gaussian', 'None'] = 'None', smoothing_half_window_size: int = 2, intensity_transformation: Literal['Log2', 'Log10', 'SquareRoot', 'None'] = 'None', pooling: Literal['Mean', 'Median', 'Maximum', 'Sum'] = 'Maximum')[source]
Bases:
objectWrapper class for M2aia’s imzML reader https://github.com/m2aia/m2aia.
Complete processing examples with focus on deep learning can be found on https://github.com/m2aia/pym2aia-examples
Example usage:
import m2aia as m2

I = m2.ImzMLReader("path/to/imzMl/file.imzML")
I.SetNormalization(m2.m2NormalizationTIC)
I.SetIntensityTransformation(m2.m2IntensityTransformationSquareRoot)
ys = I.GetMeanSpectrum()
xs = I.GetXAxis()
ppm = 75
image_data = I.GetArray(xs[len(xs)//2], ppm)
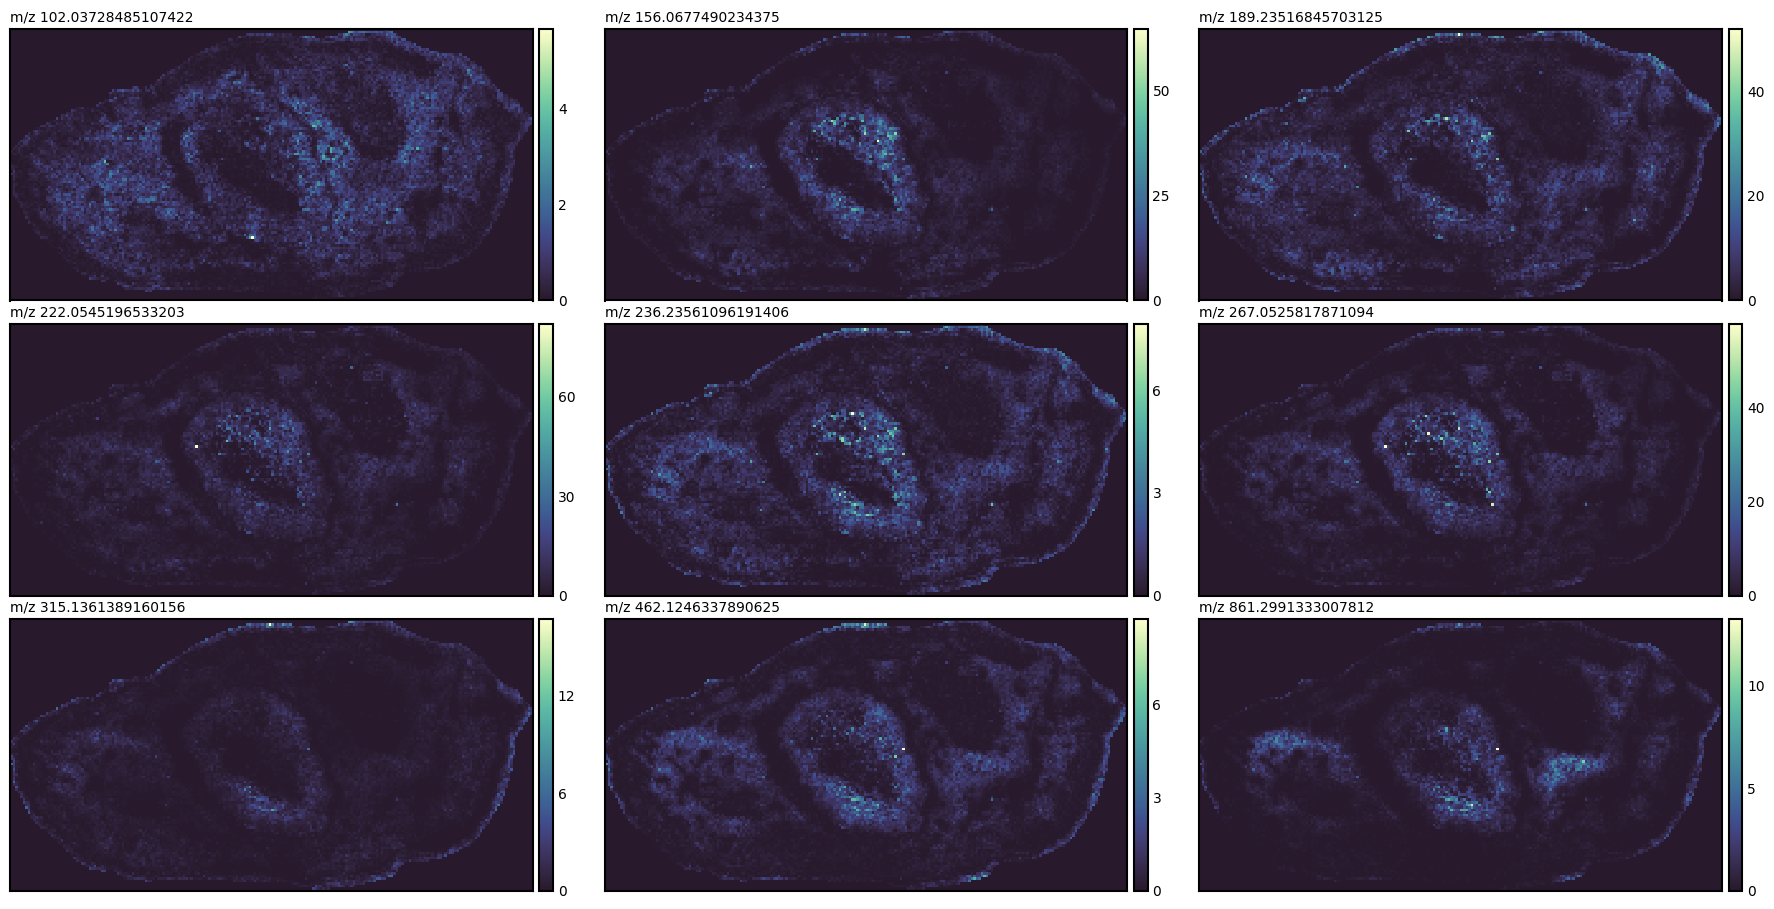
Example usage (Centroid Data with few features):
import m2aia as m2
import seaborn_image as sbi

# a centroid dataset with a few (<100) features
# original dataset: https://www.ebi.ac.uk/metabolights/editor/MTBLS2639
# processed centroid dataset: https://data.jtfc.de/150429_ew_section1_pos_centroids.zip
I = m2.ImzMLReader("MTBLS2639/150429_ew_section1_pos_centroids.imzML")
xs = I.GetXAxis()
xs = xs[::8] # show every 8th peak
ion_images = []
for k in range(len(xs)):
    ion_images.append(I.GetArray(xs[k], 1)[0])

g = sbi.ImageGrid(ion_images, aspect=2/1)
for x, ax in zip(xs, g.axes.flat):
    ax.set_title(f'm/z {x}', loc='left', fontsize=10)
- CheckHandle()[source]
Check if the handle was initialized properly. To prevent this check from throwing an exception you must call Execute() once.
- Raises:
ReferenceError: is invalid file name and or not yet called Execute().
- GetArray(center, tol, dtype=<class 'numpy.float32'>, squeeze: bool = False) ndarray[source]
Get the (ion) image data as numpy array. The pixel values are the pooled intensities (ie. pooling strategies like the ‘Mean’, ‘Median’, ‘Maximum’, or ‘Sum’) in the interval [center-tol, center+tol] of the spectra.
- Returns:
Numpy array of size [x,y,z] with dtype=dtype.
- Parameters:
center – value on the x axis.
tol – tolerance for query points on the x axis around the center in ppm. Tolerance is center +/- tol*center.
dtype – array element type [np.float32, np.float64].
squeeze – Remove all dimensions if any is smaller or equals 1.
- Raises:
TypeError: Image pixel type is not one of [np.float32, np.float64]
- GetImage(center, tol, dtype=<class 'numpy.float32'>) Image[source]
Get the (ion) image data as parameterized SimpleITK.Image.
m2aia.ImzMLReader.GetArray()- Returns:
sitk.Image of size [x,y,z] with dtype=dtype.
- Parameters:
center – value on the x axis.
tol – tolerance for query points on the x axis around the center in ppm. Tolerance is center +/- tol*center.
dtype – array element type [np.float32, np.float64].
squeeze – Remove all dimensions if any is smaller or equals 1.
- Raises:
TypeError: Image pixel type is not one of [np.float32, np.float64]
- GetIndexArray() ndarray[source]
Get the index image data as numpy array. The pixel values are the spectrum IDs starting with 0. Use the mask array to identify valid spectrum IDs.
Access valid spectrum IDs:
indexImage = I.GetIndexArray()
maskImage = I.GetMaskArray()
validIndices = indexImage[maskImage > 0]
- Returns:
Numpy array of size [x,y,z] with dtype=np.uint32.
- GetIndexImage()[source]
- Get the index image data as parameterized SimpleITK.Image.
This method calls
GetIndexArray()
- Returns:
sitk.Image of size [x,y,z] with dtype=np.uint32.
- GetIntensities(index, ys=None) array[source]
Query the y-axis (ys) values for a given spectrum id.
- Parameters:
index – Id of a spectrum in the image.
ys – By passing a np.array (dtype=np.float32) from external, this np.array can be reused and do not require an extra memory allocation. Otherwise a new array is created.
- Returns:
A list of two np.array elements [xs,ys]. xs = x-values; ys = y-values.
- Raises:
IndexError: if index is not in the range of valid spectra indices [0,self.number_of_spectra-1]. TypeError: if the ImzML file format is not continuous profile/centroid!
- GetMaskArray() ndarray[source]
Get the mask image data as numpy array. The binary mask indicates valid spectra (pixel value >= 1) and background (pixel value == 0).
- Returns:
Numpy array of size [x,y,z] with dtype=np.ushort.
- GetMaskImage() Image[source]
Get the mask image data as parameterized SimpleITK.Image. The pixel values indicate valid spectra (pixel value >= 1) and background (pixel value == 0).
- Returns:
sitk.Image of size [x,y,z] with dtype=np.ushort.
- GetMaxSpectrum() array[source]
Get the overview spectrum (max over all spectra).
- Returns:
np.array with maximum intensity values of all spectra.
- GetMeanSpectrum() array[source]
Get the overview spectrum (mean over all spectra).
- Returns:
np.array with mean intensity values of all spectra.
- GetMetaData() Dict[str, str][source]
Returns a dictionary of all meta data information retrieved by m2aia.
- Returns:
List of strings of meta data.
- GetNormalizationArray(type) ndarray[source]
Get a normalization image data as numpy array.
- Returns:
Numpy array of size [x,y,z] with dtype=np.float64.
- GetNormalizationImage(type) Image[source]
Get a normalization image data as parameterized SimpleITK.Image.
- Returns:
sitk.Image of size [x,y,z] with dtype=np.float64.
- GetNumberOfSpectra() int[source]
Get the number of valid spectra in the image. This can be used to iterate over all spectra in the image using a for loop:
for i in range(GetNumberOfSpectra()):
    xs, ys = reader.GetSpectrum(i)
- Returns:
Number of valid spectra.
- GetOrigin() array[source]
Get the image origin.
- Returns:
The origin in world coordinates of the image as numpy array of size [3] and dtype=np.float64.
- GetParametersAsFormattedString()[source]
Transform signal processing parameters into a fomatted string representation.
- GetShape() array[source]
Get the shape of the image.
- Returns:
numpy array of size [3] for the x,y,z image dimensions (in number of pixels).
- GetSizeInBytesOfYAxisType() int[source]
Get number of bytes used to store the intensity values.
- Returns:
The number of bytes.
- GetSpacing() array[source]
Get the pixel spacing of the image
- Returns:
numpy array of size [3] and dtype=np.float64 for the pixel size in x,y,z dimension (in millimeter).
- GetSpectra(indices: List[int]) ndarray[source]
Query a set of intensities by a list of indices. Only continuous imzML files.
- Parameters:
indices – List of Ids of spectra in the image.
- Returns:
a np.ndarray of shape [len(indices), self.depth].
- Raises:
IndexError: if index is not in the range of valid spectra indices [0,self.number_of_spectra-1]. TypeError: if the ImzML file format is not continuous profile/centroid!
- GetSpectrum(index) List[array][source]
Query the x-axis (xs) and y-axis (ys) values for a given spectrum id.
- Parameters:
index – Id of a spectrum in the image.
- Returns:
A list of two np.array elements [xs,ys]. xs = x-values; ys = y-values.
- Raises:
IndexError: if index is not in the range of valid spectra indices [0,self.number_of_spectra-1].
- GetSpectrumDepth(id) int[source]
Get the size of the x axis for a specific spectrum of the image. This method is helpful for processed (centroid) imzML files. For continuous (centroid/profile) imzML files use GetXAxisDepth(self).
- Parameters:
id – Id of a spectrum in the image.
- Returns:
Number of x values.
- GetSpectrumPosition(id) array[source]
Get the image index position for a given spectrum id.
- Parameters:
id – the id of a spectrum (may be different to the ids given in the imzML).
- Returns:
Position in index coordinates as numpy array of size [3] and dtype=np.int32.
- GetSpectrumType() str[source]
Get the imzML type, i.e. continuous/processed profile/centroid.
- Returns:
The type of the imzML as string.
- GetTolerance() float32[source]
Get the current tolerance value.
- Returns:
np.float32 The current tolerance value.
- GetXAxisDepth() int[source]
Get the size of the x axis. For processed imzML files, this value is the number of bins used to represent the x-axis.
- Returns:
Number of x values.
- GetYDataType()[source]
Return the intensity data type defined in the imzML file.
- Returns:
np.float32 or np.float64; if not defined return None
- SetBaselineCorrection(strategy: Literal['TopHat', 'Median', 'None'], half_window_size=50)[source]
Set the baseline correction strategy.
- Parameters:
strategy – Set the basline correction strategy using one of the m2BaselineCorrection literals.
half_window_size – 2*half_window_size + 1 spectrum points are used for BaselineCorrection.
- SetIntensityTransformation(strategy: Literal['Log2', 'Log10', 'SquareRoot', 'None'])[source]
Set the intensity transformation strategy.
- Parameters:
strategy – m2IntensityTransformation Set the intensity transformation strategy using one of the m2IntensityTransformation literals.
- SetNormalization(strategy: Literal['TIC', 'Sum', 'Mean', 'Max', 'RMS', 'Internal', 'External', 'None'])[source]
Set the normalization strategy.
- Parameters:
strategy – m2Normalization Set the normalization strategy using one of the m2Normalization literals.
- SetPooling(strategy: Literal['Mean', 'Median', 'Maximum', 'Sum'])[source]
Set the pooling strategy.
- Parameters:
strategy – m2Pooling Set the pooling strategy using one of the m2Pooling literals.
- SetSmoothing(strategy: Literal['SavitzkyGolay', 'Gaussian', 'None'], half_window_size=2)[source]
Set the spectrum smoothing strategy.
- Parameters:
strategy – Set the smoothing strategy using one of the m2Smoothing literals.
half_window_size – 2*half_window_size + 1 spectrum points used for smoothing.
- SetTolerance(tol: float32)[source]
Set the tolerance value.
- Parameters:
tol – np.float32 The tolerance value to be set.
- SpectrumIterator()[source]
Create a spectrum iterator/generator, yielding all valid spectra. This can be used to iterate over all spectra in the image using a for loop:
for i,xs,ys in reader.SpectrumIterator():
    ...
- Returns:
a triplet with (i=spectrum-id, xs=x-values, ys=y-values)
- SpectrumRandomBatchIterator(batch_size)[source]
Create a spectrum batch iterator/generator, yielding a batch of ys-values of spectra in a random order with repetitions.
Example:
for ys_batch in reader.SpectrumRandomBatchIterator(batch_size = N):
    ...
- Returns:
a np.array as batch of intensities with shape [batch_size, self.depth]
- WriteContinuousCentroidImzML(path: str, centroids)[source]
Given a list of centroids, write a continuous centroid imzML to the given path. Use ‘SetTolerance’ to define the range query for each centroid (ppm).
- Parameters:
path – Target file path the <path>.imzML and the <path>.ibd is written to.
centroids – a list of centroids.
Example usage:
import m2aia as m2

I = m2.ImzMLReader("path/to/imzMl/file.imzML")
I.SetTolerance(75)
I.WriteContinuousCentroidImzML("path/to/imzMl/file.imzML", [300, 400, 500])